Help page
ChromoMapperWeb is a web tool designed to evaluate and visualize genome assemblies. Starting from the results of a mapping procedure carried out on a reference genome, it quickly identifies and displays similarities and differences between compared genomes or assemblies using both tables and graphic representations.
ChromoMapperWeb works on and directly reads output files produced by Quast or nucmer, from the mumMer package, or other similar alignment tools. It can align one or more genomes to a reference one, producing mapping data integrated with external chromosomal info and used in a broad range of interactively browsable graphical views.
If you just want to see how the program works, click on the Try sample data button on the main page.
No previous registration is required to access the site. By clicking on ”Work on new data”, you create a temporary dataset where you can add alignments or genome sequences and store results which will remain available as long as your browser is open. You can return to the data by downloading and saving a link which will remain active for 48 hours.
For longer-term storage, you can optionally define an alphanumeric string tag before uploading data: this will allow to store data on the server, while ensuring separation of the different tagged spaces and retaining privacy via a five-character alphanumeric code. A user can use more tags to store his files in different spaces for different projects, for example.
Tagged data may be accessed by clicking on ”View your data” on the main page and typing a ”tag:code” combination in the dialog. A list page containing all runs stored under a given tag lets you view and navigate through the stored experiments.
No matter whether you tag your data or not, you can either directly upload an alignment result, obtained by Quast or nucmer, or upload two or more genome assemblies and align them within ChromoMapperWeb.
|

To upload an alignment result, click on ”Upload alignment” button.
The import page is organized in two sections. In “Run Info”, you define the general alignment run information, such as date, name and the genome used as a reference; you can upload an optional “Reference genome data“ file, containing names and lengths of the reference genome chromosomes (see example). You also have to select the alignment source type by choosing between “Nucmer file”, “Quast file” or “Quast Folder”.
In the last case, you upload a zipped Quast result folder, which will be used to automatically fill the “Experiments” section. If you choose any of the other options, you will have to upload an alignment file in tsv format for each experiment. As an alternative to uploading files, you can provide a URL pointing to a file or to a folder. Files addressed in this way will not be uploaded but will be read as needed, to produce the results to be visualized.
|
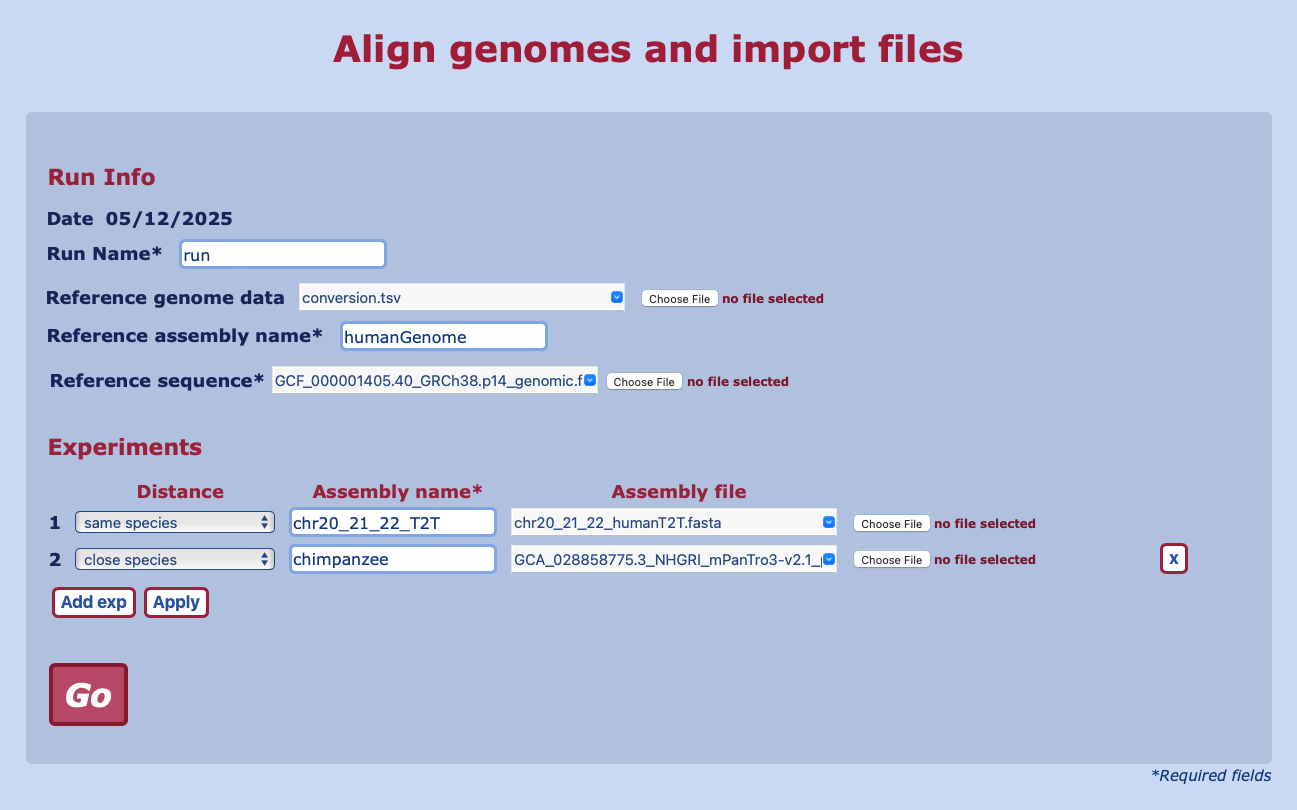
Users with no access to Quast or other alignment programs can align genome sequences with nucmer by clicking on ”Upload and align seqs” button. Alignment of smaller sequences will be done immediately while complete mammalian genomes will be scheduled according to available resources and become analyzable when ready.
As for import, the page is organized in two sections. The first allows you to define a name for the run and optionally upload a file (Reference genome data) containing the reference chromosomes with their lengths (see example). In the same section, you choose the sequence to be used as reference and define its name.
In the “Experiments” section, for each alignment, you choose a sequence among the available ones or upload a new one and define an expected distance from the reference, which will affect the parameters used for the alignment. You can monitor your run or even close the page; the alignment will continue while you perform other analyses and appear in the list page once finished.
|

|
In the list page, you can choose the run or the specific experiment you want to see. Experiment data is displayed using different views, selectable through tabs leading to different sheets, as in a spreadsheet-like organization. The different tabs represent the main alignment regions at block, reference chromosome or assembly contig scale and highlight similarities and colinearity between compared sequences, points of inconsistency, discontinuities, repeated regions and interruptions in the assembled sequences. Each view uses tables and graphics to provide a summary of reference genome coverage, chromosome by chromosome, as well as graphical representations which highlight alignment blocks in detail.
The above figure shows the “Block stats” table, which provides statistics about alignment blocks, organized in groups according to their length. On the right side, you find a dialog which allows to interactively re-calculate table content after changing one or more parameters. The ⓘ button at the top-left shows additional information about the table and its columns.
Some tables contain links for producing other tables or plots with selected results.
|
Within “Block stats” the “bubbles” column allows to display a customized bubble plot for blocks longer than a given threashold level. In the plot, contigs are represented as bubbles with size depending on the number of bases involved in the contig/chromosome alignment. A gradient is used to distinguish continuous alignments (white-yellow-red) from those split into a larger number of blocks (blue-black). As for tables, a dialog allows to re-calculate the plot after changing one or more parameters; it may be invoked by clicking on the ☰ button on the left side of each plot. Similarly, an in-depth description of the analysed plot may be visualized by clicking on the ⓘ button.
|

|
The “Chromosomes” tab is used to display a table which lists all reference chromosomes and, for each of them, provides parameters describing their coverage by assembly contigs. The tab is only available when information about the chromosomes is available, either guessed from alignment data or provided by the user by uploading a “Reference genome data“ file. Within “Chromosomes”, the “refID” column provides links that use the “Chromomap” table to display in table form all the alignment blocks on the selected chromosome. Two more columns, “Map” and “Contigs”, provide graphical views of alignments blocks and contigs positioned according to the position on which they map on the chromosome. Genome-wide graphics may be produced by clicking on additional buttons located below, under the table.
|

|
The “Chromomap” plot is a dotplot-like representation, where blocks are reported as segments positioned according to their location on chromosome (x axis) and contig (y axis); block orientation is tagged by using start (circle) and stop (triangle) symbols. Long linear stretches of segments indicate perfect correspondence between contigs and reference genome, while insertions and deletions produce jumps from one diagonal line to a parallel one. Dotted lines are used to connect contiguous contig blocks matching in different places on the reference chromosome.
|

|
In the “Contigs” representation, the contigs mapping on a given chromosome are reported aligned with the corresponding chromosome postion; thin lines are used to connect, as in the “Chromomap” plot, contigous contig blocks that map in different places on the chromosome. The plot uses the y axis to separate different contigs mapping on the same chromosome. The colour of a block corresponds to the contig it belongs to.
|

|

|
Four buttons located under the table are used to produce genome-wide plots.
“ChromoLength” is a genome-wide bar plot representing the chromosome fraction covered by the sequences of the test assembly. “Contigs on chromosomes” (figure on the left) reports alignment blocks as rectangles coloured according to the contig they belong to; thin horizontal lines connect contiguous blocks from the same contig. The “Blocks on chromosomes” plot is the same, except that block start and stop positions are marked by black vertical segments.
|
“Gaps on chromosomes” shows in black genome regions not covered by aligned sequences (gaps).
In all plots, zooming on selected areas of the image allows to better observe the local features of alignment blocks. Multiple zoom levels are usually available to access different degree of details.
For some plots (“Contigs on chromosomes”, “Blocks on chromosomes”, “Contigs” and “Chromomap”), a gray-scale palette is provided as well as alternative colour palettes tuned for different types of color blindness (protanopia, deuteranopia and tritanopia).
|

|

|
As for chromosome level analysis, other alignment features are available in the other tabs, where the alignment can be analysed by highlighting block and contig features. Each table or plot provides information about the respective contents. In addition to pre-formatted graphics, custom graphics can be produced on the spot while viewing every table, which allow to plot any data column against any other. Just click on each column heading to see the column data plotted against the ID column. You can further customize the graph by choosing another column as the x axis or by selecting a different plot types in the menus under the table.
|
FAQs
- How do I download tables from web site?
Tables produced by the web server may be downloaded through a button located in the bottom-right corner.
- How do I download plots from web site?
Users can choose the format for plot downloading through a pop-up menu located in the top-left corner and then download them through a button located in the top-right corner.
- Why only one or a few sequences appear as chromosomes and others are ignored?
The tool is using a “chromosome guess” feature, which tries to distinguish chromosomes from extra chromosomal sequences, which are separately analysed in the “Extrachromo” tab. Chromosome organization of the reference genome may be configured as desired by providing an appropriate “Reference genome data” file while setting up import or alignment. Chromosomes may also not appear in the Chromosomes table if the calculated alignment does not include block larger than the current threshold (10k by default); try reducing “Min block length” value in dialog of plots and tables.
- How do I use block highlighting in the multiple-assembly plots?
In multi-assembly plots, contig highlighting works in one of two modes, toggled by clicking on a button (third of the top-left row) and specified in the relative tip. In “selected track” mode, highlighting is limited to the blocks of the same contig within the clicked assembly, while, in “all tracks” mode, it is extended to include blocks from other assemblies, if they belong to a contig sharing the same colour code. In an attempt to give, whenever possible, the same colour to larger contigs covering each chromosome, colour is, in fact, assigned according to contig rank after size-sorting.
- How do I read alignment block colour in Contigs on chromosomes multi-assembly plots?
In these plots, colour is assigned according to contig rank after size-sorting, in an attempt to give, whenever possible, the same colour to larger contigs covering each chromosome.
- How do I distinguish the different tracks in multiple assemblies plots (e.g., in “Contigs on chromosomes”)?
Tracks are always displayed (top to bottom) in the order provided during the import/alignment setup and used in the “Run” table. In multiple assembly plots, a legend may be shown by toggling it on/off with the relative button (top-left corner, fourth from left).
|
How to reference
ChromoMapperWeb has been published in the article:
Elvira Toscano, Elena Cimmino, Angelo Boccia, Leandra Sepe, Giovanni Paolella, ChromoMapperWeb: evaluate genome alignments and track assembly steps within an interactive graphic environment, Nucleic Acids Research, 2026;, gkag506,
https://doi.org/10.1093/nar/gkag506
The article provides further details about design, implementation and utilization of the program.
|
Download PDF
|
|
|
|
|
|
|
|
|